EG Aquarii: discovery of its SU UMa nature
")
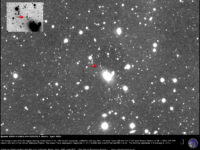
EG Aquarii (2006)
The International Astronomical Union published CBET 736 with the following findings!
On Nov. 8.44, 2006 R. Stubbing (AU) spotted this star at mag. 12.4, that is clearly in a bright outburst. The historical record shows that only two previous outbursts were detected in past: in 1958 and 1959. So, this new one was the very first after such a long time, ready to be investigated with modern technology.
As soon as the evening reached Italy, the Virtual Telescope was remotely slewed to this very-high-priority target, which appeared still bright. Time-resolved photometry was promptly started and real-time data reduction performed: after about 30 minutes, it was clear that EG Aqr was clearly showing superhumps (0.10 mag large), a clear signature of SU UMa stars in superoutburst.
")
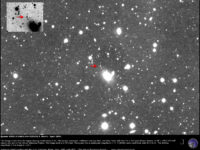
Discovery of superhumps in EG Aqr (8 Nov. 2006)
So, the Virtual Telescope observations discovered the nature of this cataclysmic variable.
A quick period determination provided a preliminary candidate of 115 minutes, close to the lower limit of the CV period gap.
During the run, the star also faded of about 0.15 mag.
The lightcurve coming from the photometric session is shown on the right.
")
EG Aqr (9 Nov. 2006)
The following night, 9 Nov. 2006, the Virtual Telescope observed the star again, finding it 0.3 mag brighter.
The coverage was 4h long and data reduction showed beautiful superhumps, 0.35 mag. large.
Period analysis provided a period of 1.99 hours, very close to period gap’s lower limit.
The resulting lightcurve is shown on the left, too.
")
EG Aqr (10 Nov. 2006)
On Nov. 10, 2006 a more extended, 5h-long photometric run was performed, under excellent sky conditions.
The resulting lightcurve is shown on the right, with clear and sharp superhumps, with a full amplitude of 0.3 mags, very similar to the previous night.
Period analysis, though, provided a candidate for Psh=1.89 hours, significantly shorter than the previous values.

9 and 10 Nov. data phased against the 1.99h Psh
At this point a joint analysis, using the whole available data, was in order to properly investigate a possible period variation.
Using 9 and 10 Nov. datasets and phasing them with the 1.99h period, the combined plot looked interesting (left), with the red points (10 Nov.) clearly NOT phased with the black ones (9 Nov.), which were ok, of course (as the tested period comes from them!).

9 and 10 Nov. data phased against the 1.9044h period
Finally, doing a joint period search, a candidate for Psh of 1.9044h provided the phased plot on the right.
A paper about this star after its interesting 2006 superoutburst is available.
Support The Virtual Telescope Project!
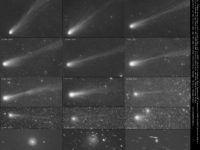
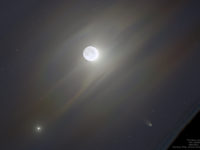
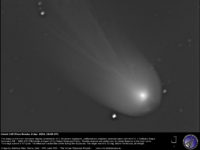
Support us! Please, donate and receive unique, LIMITED EDITION set of images of the stunning comet 12P/Pons-Brooks with Andromeda Galaxy, of potentially hazardous asteroids, space stations and much more, specifically made for supporters like you!
(you can adjust the amount later)